Windows Perfmon, Disk I/O and Possible Disk Issues
As most SmarterMail administrators know, a server's hard disks are some of the most heavily used resources when it comes to managing a secure mail server and often have the biggest impact on how that mail server performs. As such, it's important to keep a close eye on your disk activity, ensuring there are no bottlenecks or latencies that can cause SmarterMail's performance to suffer.
And when it comes to monitoring server performance on Windows, there's no better tool than the one built-in: Windows Performance Monitor! PerfMon, as it's commonly known, is a console snap-in that provides tools for analyzing your system's performance. It's great to use for recording a performance baseline, monitoring your daily activity, troubleshooting server data or discovering potential disk issues before they occur.
Follow along to learn how to configure PerfMon to capture information pertaining to your email server's disk I/O utilization. There are three sections in this guide: (1) steps for configuring a monitor to view data in real-time, (2) steps for configuring a data collection set in which data can be captured over a period of time and (3) an explanation of the performance counters and their expected values.
Note: While the interface may vary slightly, the steps for configuring PerfMon remain consistent across supported server versions. The screenshots provided here were taken from Windows Server 2008 R2.
Monitoring Disk I/O Activity in Real-Time
Configuring PerfMon to Monitor Performance Counters
To monitor your disk activity in real-time and catch disk I/O bottlenecks before they occur, you'll need to configure certain performance monitors within PerfMon:
- On the Windows server where SmarterMail is installed, open Performance Monitor. This can be opened from the Start menu by clicking on Administrative Tools and selecting Performance Monitor OR by opening the Run command, entering "perfmon.exe" and clicking OK.
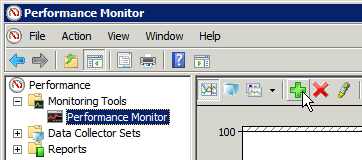 Once open, add a new counter. This is done by expanding the
Monitoring Tools folder in the navigation pane and clicking on Performance Monitor. In the toolbar of
icons above the main window, click the green plus sign (+) icon. The counter settings will load in a popup
window.
Once open, add a new counter. This is done by expanding the
Monitoring Tools folder in the navigation pane and clicking on Performance Monitor. In the toolbar of
icons above the main window, click the green plus sign (+) icon. The counter settings will load in a popup
window.
- In the popup window, find the 'Instances of selected object' section and select the physical disk(s) you want to
monitor. Highlight <All instances> to monitor all disks on the server in the same report. To
monitor one or multiple disks individually, select each individual volume. By default, _Total will be selected;
however, this is the sum of all your disks and won't provide meaningful data for this configuration. (It's
important to do this step before selecting performance counters, as changing the selected instance could remove
the highlighting from the chosen performance counters.)
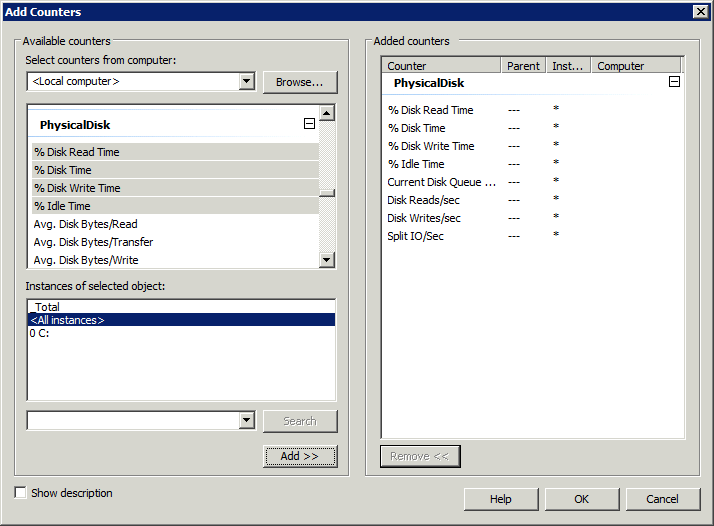
- Next, go to the 'Available counters' section and find PhysicalDisk. Expand its additional options and
highlight the following counters:
- % Disk Read Time
- % Disk Time
- % Disk Write Time
- % Idle Time
- Current Disk Queue Length
- Disk Reads/sec
- Disk Writes/sec
- Split IO/sec
- Click Add >>. The highlighted counters will be shown in the 'Added counters' section on the right-hand side of the window.
- Click OK to close the Add Counters dialog window.
Monitoring Real-Time Disk Activity
As soon as you close the Add Counters window, you'll be dropped back into the PerfMon section where you can begin monitoring your results!
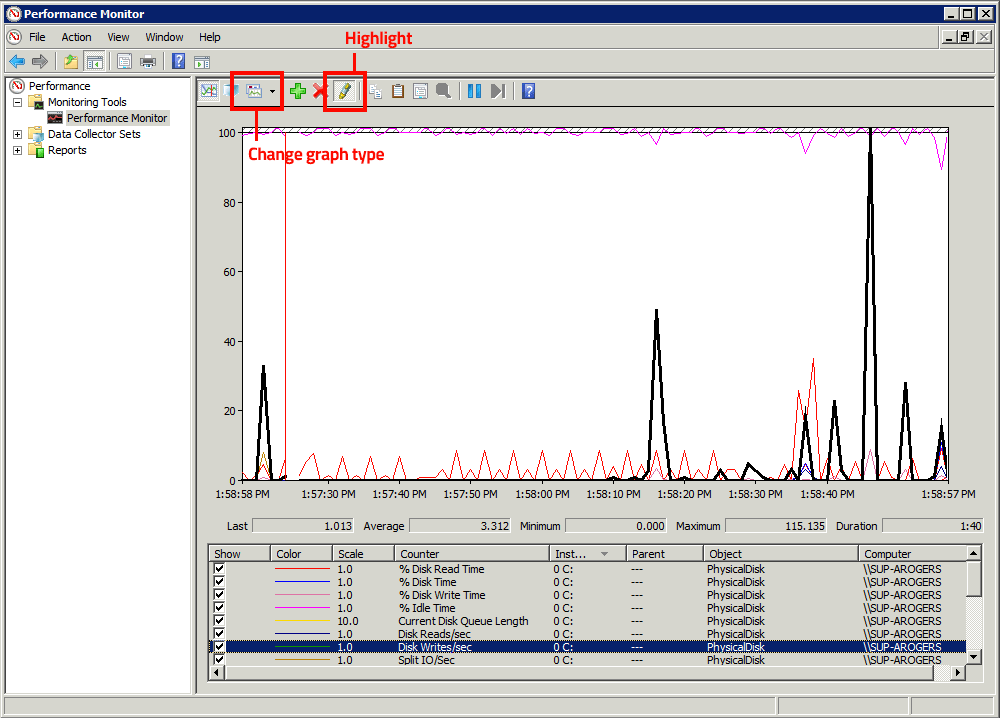
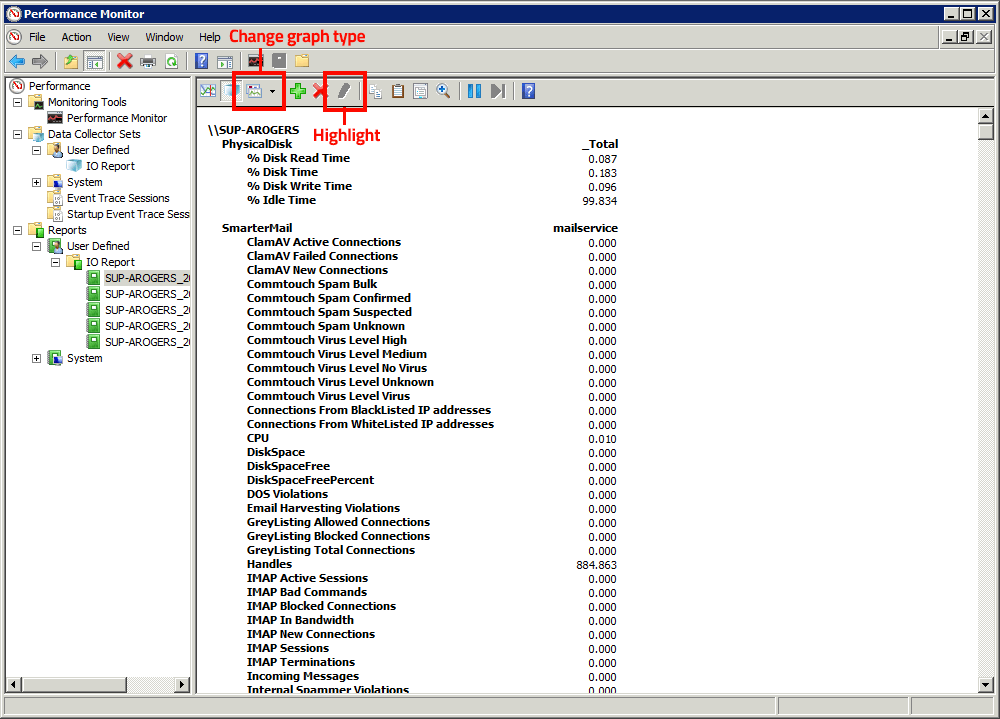
There are three types of graphs that you can choose to view: Line, Histogram Bar or Report. To toggle through the options, use the Change graph type button to the left of the plus sign (+) or press Ctrl+G on your keyboard. We prefer reviewing the Report type as this lays out your data in a neat table; however, when you're monitoring quite a few disks, you may not be able to view all disk data simultaneously.
So, if you review your results using the Line or Histogram Bar graphs instead, here are some things to be aware of: If you chose <All instances> or the individual disk(s) when adding your performance counters, each counter will be listed one time for every disk you're monitoring. Use the column's sorting options to group disks together by Instance for easier review.
You may also find the Highlight toolbar button to be extremely useful in these views. When enabled, the performance counter currently selected at the bottom of the window will have its corresponding line/bar highlighted in black within the graph.
Monitoring Disk I/O Activity Over a Period of Time
Configuring PerfMon's Data Collector Set
Now that your real-time monitoring is squared away, we can move on to capturing data sets over a period of time. This configuration is extremely useful for those incidents that are tough to catch in real-time. For example, an issue that occurs once every hour, happens sporadically or one that pops up after-hours.
To capture disk data over a period of time, we'll configure a Data Collector Set within PerfMon that can be started and stopped as needed:
- On the Windows server where SmarterMail is installed, open Performance Monitor. This can be opened from the Start menu by clicking on Administrative Tools and selecting Performance Monitor OR by opening the Run command, entering "perfmon.exe" and clicking OK.
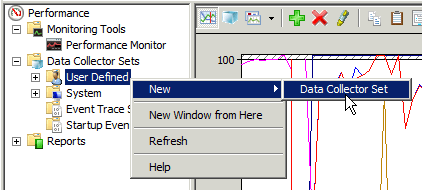 Once open, add a new Data Collector Set. This can be
done by expanding the Data Collector Sets folder in the navigation pane. Then right-click on User Defined, hover
over New and select Data Collector Set. The collector set settings will load in a popup window.
Once open, add a new Data Collector Set. This can be
done by expanding the Data Collector Sets folder in the navigation pane. Then right-click on User Defined, hover
over New and select Data Collector Set. The collector set settings will load in a popup window.
- In the Create new Data Collector Set dialog window, enter a friendly name for your report, such as "IO Report." Select the bulleted option to Create manually (Advanced). Click Next.
- On the next screen, select the bulleted option to Create data logs and checkmark Performance counter. Click Next.
- Now, click on Add.... A window for the performance counter settings will appear.
- In the popup window, find the 'Instances of selected object' section and select the physical disk(s) you want to monitor. Highlight <All instances> to monitor all disks on the server in the same report. To monitor one or multiple disks individually, select each individual volume. By default, _Total will be selected; however, this is the sum of all your disks and won't provide meaningful data for this configuration. (It's important to do this step before selecting performance counters, as changing the selected instance could remove the highlighting from the chosen performance counters.)
- Next, go to the 'Available counters' section and find PhysicalDisk. Expand its additional options and
highlight the following counters:
- % Disk Read Time
- % Disk Time
- % Disk Write Time
- % Idle Time
- Current Disk Queue Length
- Disk Reads/sec
- Disk Writes/sec
- Split IO/sec
- Click Add >>. The highlighted counters will be shown in the 'Added counters' section on the
right-hand side of the window.
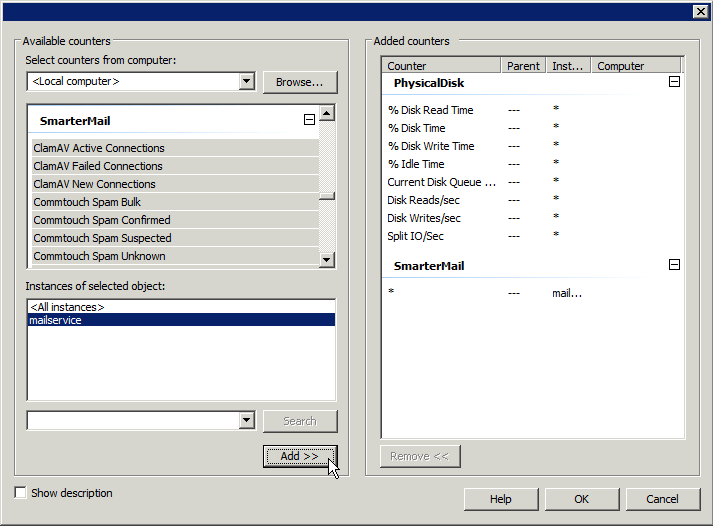
- Next, find SmarterMail within the list of 'Available counters.' Expand its additional options and highlight each one. (These counters will be helpful by allowing you to compare the values of normal disk activity versus high disk I/O. For example, during an instance of high disk I/O, you could potentially see an influx of IMAP connections, SMTP connections, file handles, threads, etc., allowing you to understand the SmarterMail sections impacted so you can troubleshoot the root cause of the issue.)
- In the 'Instances of selected object' section, select the mailservice instance. (If you click on mailservice immediately after highlighting all SmarterMail counters, all counters should still be highlighted.) Then click Add >>. The counters will be shown in the 'Added counters' section, indicated with an asterisk (*).
- Click OK to close the window and return to the Create new Data Collector Set dialog window. The performance counters just added will be displayed.
- Adjust the Sample Interval as desired. In most cases, 15-30 seconds is enough (and can be adjusted in the future if needed). Click Next.
- Set the Root directory path. This is where the actual report data will be saved. It's recommended to save this to a volume that is not low on disk space, as these reports can get fairly large if left running for a long period of time (days). Notate this location so you can pull from this path, if needed. Click Next.
- Leave the Run as: option at <Default>, unless special permissions are necessary for your environment. In the bulleted options below, select Save and close. Click Finish.
Collecting Data Over a Period of Time
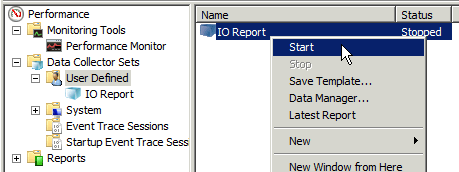
When the wizard has finished, you'll be dropped back into the PerfMon window where you can begin collecting data for your report! Find the "IO Report" (or whatever friendly name you used) by expanding the Data Collector Sets folder and clicking on User Defined. To begin capturing the Disk I/O and SmarterMail data, right-click on the report name at any time and click Start. Once the data has been captured for the desired period, right-click again and choose Stop.
Reviewing the Data Collector Set Report
To review the data you've collected, head over to the Reports folder and expand User Defined. Here you'll see the name of your report and, below it, each set of data that has been collected. Select the latest report to view its information.
There are five types of graphs that you can choose to view: Line, Histogram Bar, Report, Area or Stacked Area. To toggle through the options, use the 'Change graph type' button to the left of the plus sign (+) or press Ctrl+G on your keyboard. Again, we prefer the Report type as this lays out your data in a neat table; however, when you're monitoring quite a few disks, you may not be able to view all disk data simultaneously.
So, if you review your results using the graphs instead, here are some things to be aware of: If you chose <All instances> or the individual disk(s) when adding your performance counters, each counter will be listed one time for every disk you're monitoring. Use the column's sorting options to group disks together by Instance for easier review.
You may also find the Highlight toolbar button to be extremely useful in these views. When enabled, the performance counter currently selected at the bottom of the window will have its corresponding line/bar highlighted in black within the graph.
Finally, if the actual report data needs to be pulled -- either for a support ticket with the SmarterTools Support Department or for you to review on an external system -- this can be obtained from the path specified in step 13.
Understanding PerfMon Counters and their Results
So now that we have all the steps in place for monitoring your disk I/O activity, it's important that you understand the information each performance counter provides, as well the results that should be expected on a healthy installation that is capable of handling the I/O requirements:
| Performance Counter | Information Provided | Expected Value |
| % Disk Read Time | Amount of time your disks are being read | Less than 15-20% |
| % Disk Time | Amount of time your disks are in use | Less than 15-20% |
| % Disk Write Time | Amount of time your disks are being written to | Less than 15-20% |
| % Idle Time | Amount of time your disks are idle or not performing any action | Over 85% |
| Current Disk Queue Length | Amount of time the Operating System must wait to access the disks | Less than 1** |
| Disk Reads/sec | Overall rate of read operations on the disk (Can be used to determine IOP's to evaluate hardware needs and as a benchmark for hardware upgrades.) | Less than 70-80%* |
| Disk Writes/sec | Overall rate of write operations on the disk (Can be used to determine IOP's to evaluate hardware needs and as a benchmark for hardware upgrades.) | Less than 70-80%* |
| Split IO/sec | Overall rate at which the operating system divides I/O requests to the disk into multiple requests. | On single disk volumes, a high Split IO/sec value may indicate a badly fragmented drive. Defraying may increase performance. |
*Though the percentages for Disk Read/sec and Disk
Write/sec can influx up to 35-40%, this isn't a firm indicator of true bottlenecking. However, if you see these
values exceed 70-80%, this indicates the disk activity is VERY high. Chances are, during this same period, you will
notice % Disk Idle sitting around 0-10%.
**In combination with high Disk Read\Write percentages, if the
Current Disk Queue Length exceeds 1-2, noticeable slowness will occur within the SmarterMail web interface and many
other aspects may be affected, including message deliveries, IMAP\EWS\EAS synchronization and more. This is because
the OS would have to queue the Read\Write operations rather than committing said operations to the disk in real
time.
There we have it! Using the steps above, you've created real-time and historical monitors to keep a close eye on your server's disk activity, and with your hard disks performing at their best, you're well on your way to a healthy, reliable and high-performing mail server.
So what other tools do you use for maintaining your mail server performance? Are there any additional performance counters you recommend monitoring? Let us know in the comments!